
DPlot v2.2.2.4

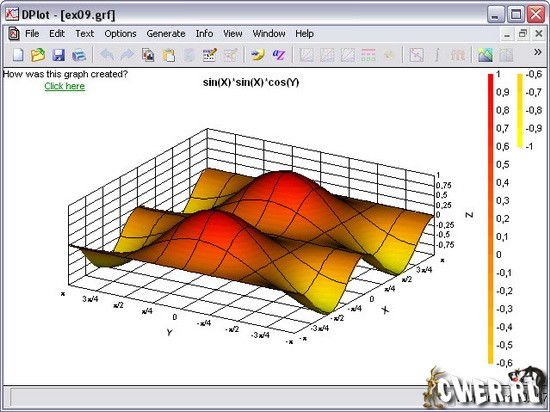
DPlot предназначена для построения графиков (2D-3D), с расширенными возможностями и научным уклоном. Будет полезна для инженеров, ученых, преподавателей и студентов.
Важной составной частью программы является наличие нескольких типов масштабирования, включая линейный, логарифмический и вероятностное масштабирование, а также несколько специальных графиков. В функции манипуляции входит FFT, фильтрация и сглаживание. Данные могут быть введены через файл, скопированы из буфера обмена, отправлены в DPlot из Excel с помощью Add-In или через динамичный обмен данными.
Compatible with Windows® 95, 98, 2000, ME, NT, 2003, XP, and Vista
Version 2.2.2.4
Bug fix: Since the addition of compressed DPlot files, the choice between "Compressed DPlot files" and "DPlot files" has been flip-flopped when using File>Save rather than File>Save As on a plot that has not previously been saved as either type. In other words, if you selected "Compressed DPlot files" in the "Save as type" box, the file was saved as ASCII text; if you selected "DPlot files" the file was saved using ZLIB compression. Thanks, David Rubin, for the assist in tracking this down.
Bug fix: Log scales with manually-set extents that were not an integer power of 10 suffered from roundoff problems in some cases. For example 0.005 might have been shown as 0.00499. This was a consequence of a recent change allowing up to 3 significant figures on log scales.
Removed a bit of legacy code that in some cases created an uneccessary delay in loading the Font dialog. In previous versions DPlot checked for the default printer, and displayed both printer fonts for that printer and screen fonts. For network printers there was often a substantial delay in retrieving printer information. The delay made sense only for printers that used printer-specific custom fonts, which to the best of my knowledge are rare in 2008. DPlot does not perform this check in this version, and displays screen fonts on the Fonts dialog. If there are any users that do use custom printer-specific fonts with DPlot, please let me know and we'll take a different approach.
Bug fix: The fix in version 2.2.2.2 for underflow values (magnitudes smaller than 2-1022) was handled poorly for 1D plots. This resulted in a crash when double-clicking a saved 1D DPlot file and, worse for new users, resulted in DPlot crashing if you replied Yes to "Do you want to view the example graphs?"
Скачать DPlot v2.2.2.4 (5.4 МБ):

Спасибо!